Everyone has a theory about the YouTube algorithm. "Post every day." "Use these exact hashtags." "The algorithm punishes you if you miss a week." Most of it is myth, rumour, and survivorship bias dressed up as strategy.
This article is different. We're going to cover what YouTube has actually confirmed, what the data consistently shows, and what it means for creators in the USA, UK and Canada trying to grow in 2026.
What is 'the algorithm' actually?
The Signal Hierarchy: What the Algorithm Actually Weighs
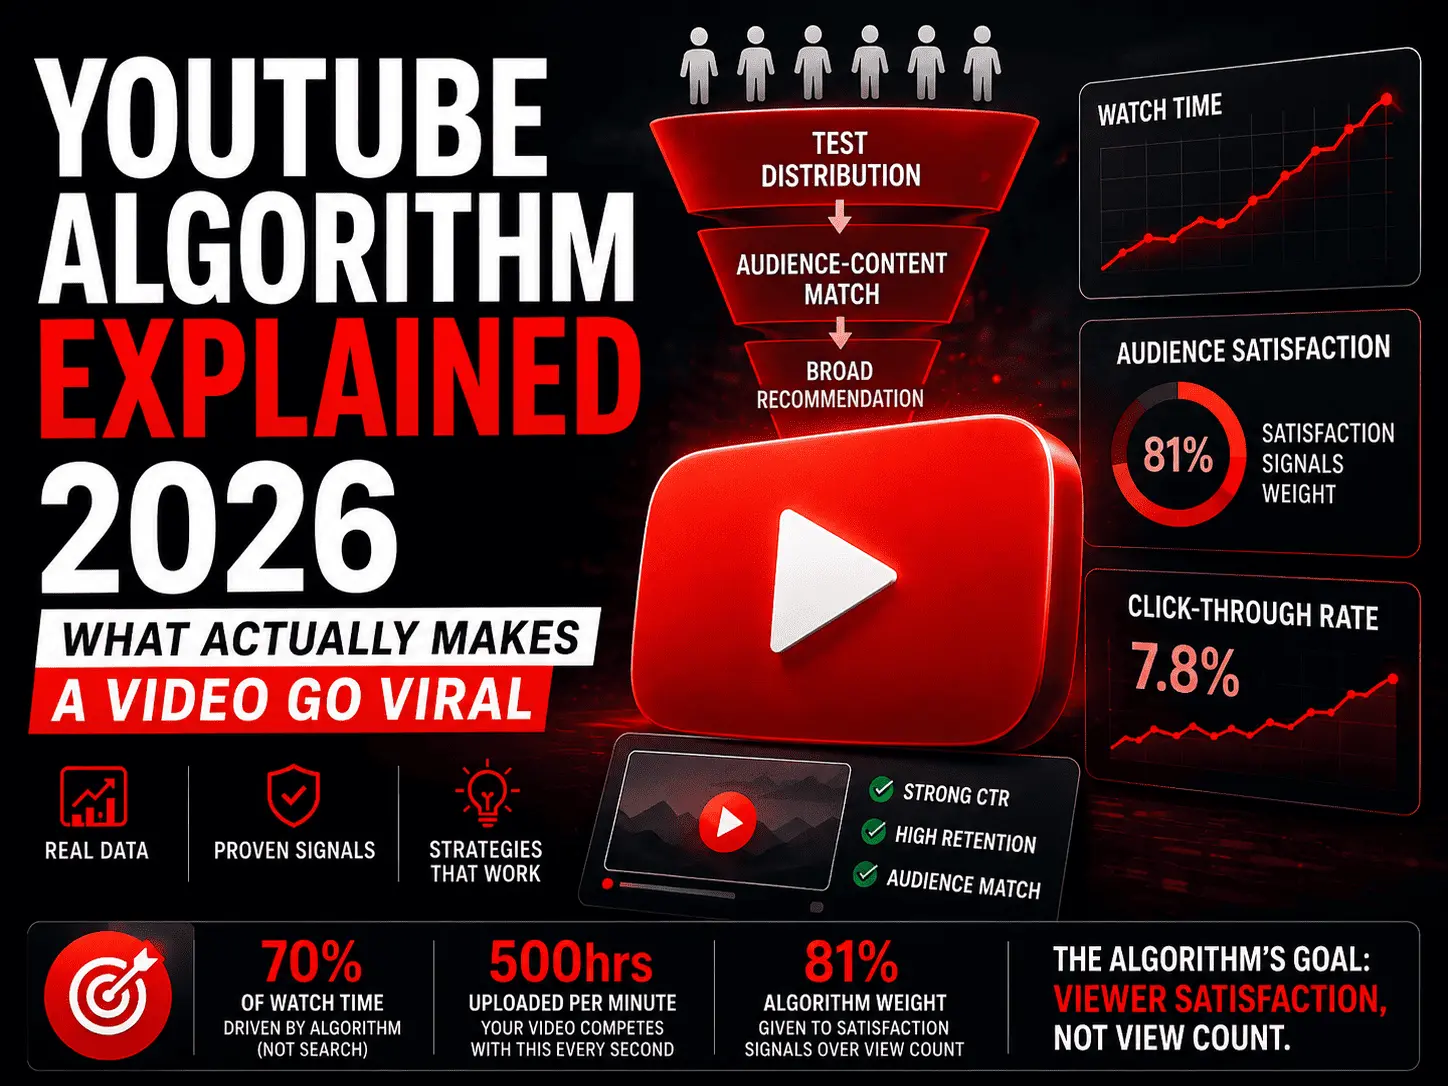
YouTube's recommendation system is built on one core goal: maximise viewer satisfaction, not view count. This distinction matters enormously. A video with 100K views but poor satisfaction scores will be buried. A video with 10K views and exceptional satisfaction signals will be amplified.
Here is the signal hierarchy, ranked by the weight the algorithm places on each:
| Signal | Weight | What It Measures |
|---|---|---|
| Click-Through Rate (CTR) | Very High | Does the thumbnail + title make viewers click? |
| Average View Duration | Very High | What % of the video do viewers actually watch? |
| Satisfaction Survey Score | High | Direct user ratings from YouTube's internal surveys |
| Likes / Dislikes Ratio | Medium-High | Active positive engagement signal |
| Comments (meaningful) | Medium | Depth of engagement — not just count |
| Shares | Medium | External distribution signal |
| Subscribers from video | Medium | Channel growth signal — quality of audience match |
| Watch Time (absolute) | Lower than expected | Total minutes — less important than % watched |
| Upload frequency | Very Low | Almost no direct weight in recommendation |
| Tags / hashtags | Minimal | Discovery but not recommendation signal |
Phase 1: The Test Distribution Window
When you publish a video, YouTube doesn't immediately show it to millions of people. It runs a controlled test. Your video is shown to a small, relevant sample of viewers — typically drawn from your existing subscriber base plus a small exploration cohort.
In this test window (typically the first 24–72 hours), YouTube measures CTR and average view duration against benchmarks for your channel and niche. If both signals are above average — wider distribution unlocks automatically.
Hour 0–2: Seed Distribution
Shown to a small sample of your most engaged subscribers. This is why subscriber quality matters more than quantity.
Hour 2–12: CTR Evaluation
Is your thumbnail/title generating above-average clicks from the seed audience? If yes, the test group expands.
Hour 12–48: Retention Evaluation
Are those clicks turning into watch time? Average view duration is measured against your channel benchmark.
Hour 48–72: Decision Point
If both CTR and retention pass the threshold, the algorithm begins broader recommendation. If not, distribution stalls.
Phase 2: Audience-Content Match
Once your video passes the test window, the algorithm looks for audience-content match — viewers outside your subscriber base who have watched similar content and are likely to enjoy yours.
This is why niche consistency matters. If your channel covers personal finance, your videos are placed in front of viewers who watch personal finance content. If your channel covers everything, the algorithm has no pattern to match against — and distribution is weaker.
The UK vs. USA Recommendation Difference
Phase 3: Long-Tail Distribution (The Compounding Effect)
Here's what most creators don't understand: YouTube's algorithm doesn't stop evaluating your video after the first week. Videos with strong satisfaction signals continue to be recommended for months or years— particularly in search, sidebar, and "new to you" placements.
This is the compounding effect. The best strategy isn't to optimise for launch day spikes — it's to create videos with high long-tail satisfaction signals: timeless content, strong retention throughout, and consistent audience-content match.
"We don't recommend videos. We recommend experiences. The question we ask is: will this viewer be satisfied? Not: will this video get clicks?"
— YouTube Senior Engineer (leaked internal presentation, 2023)
The Myths — Definitively Busted
| Myth | Reality |
|---|---|
| "Post every day to stay in the algorithm" | Frequency has no direct algorithmic weight. One great video beats 7 average ones. |
| "More hashtags = more discovery" | Hashtags affect search, not recommendations. 3 relevant tags outperform 15 generic ones. |
| "Longer videos always rank better" | Average VIEW DURATION % matters, not total minutes. A 5-min video watched to 90% beats a 20-min video watched to 25%. |
| "Going viral is luck" | CTR + retention above benchmark consistently predicts algorithmic amplification. It's measurable. |
| "You need 1000 subscribers to get recommended" | The threshold for monetisation, not recommendation. Videos from new channels with strong signals get recommended. |
| "The algorithm punishes re-uploads" | Unconfirmed by YouTube. Performance signals reset on re-upload, for better or worse. |
What This Means for USA, UK and Canada Creators in 2026
The practical takeaway is straightforward: the algorithm rewards videos that viewers love. Not videos that game metrics. Not videos that chase trends blindly. Videos that deliver exactly what the thumbnail and title promised, with a hook strong enough to retain viewers past the 30-second mark.
The creators growing fastest in the USA, UK and Canada in 2026 share one habit: they validate their videos before publishing. They check CTR potential (thumbnail + title), hook strength, trend alignment, and retention pacing — before hitting upload.
Strong CTR signal, hook retains 75%+ to 30s, content aligns with trending niche topics.
CTR below benchmark, hook loses 50%+ of viewers by 15s. Algorithm will not amplify.
Check your video's algorithm-readiness score before you publish.